Muse 101 — How to start Developing with the Muse 2 right now
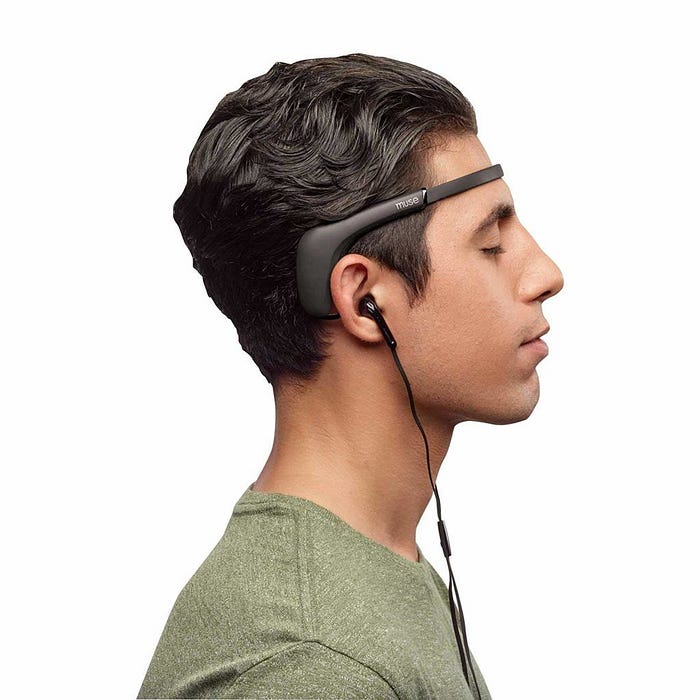
Controlling technology with your mind hasn’t been exclusive to science fiction for many decades now, and today, everyday consumers have access to a variety of Brain-computer interface technologies that they can tinker with. A fan favourite among the BCI community, the Muse 2 EEG headband is a great piece of starter to technology to get into modern-day mind control, and in this article, I’ll be covering how you can start using your Muse 2 for applications outside of meditation.
What is the Muse 2?
Released in late 2018, the Muse 2 is (confusingly) Interaxon’s 3rd generation EEG headband. Primarily advertised as a neurofeedback tool, the headband tracks heart rate (PPG + Pulse Oximetry), angular velocity (gyroscope), proper acceleration (accelerometer), and electroencephalography (dry electrodes) to assist you in your meditation sessions.
The main attraction of the Muse 2 are its electroencephalography (EEG) electrodes; they’re what measure you’re brainwaves. EEG is a neuroimaging technique that allows us to listen to the complicated firing of neurons in the brain using voltage signals.
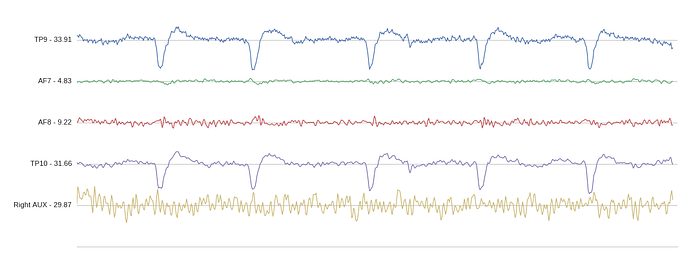
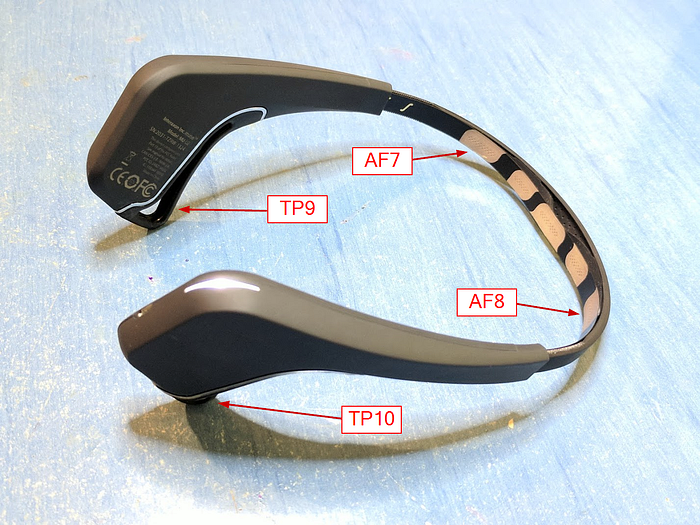
The Muse 2 measures these signals through 2 electrodes on the forehead (AF7 and AF8), which measure activity from the frontal lobe, and an electrode above each ear (TP9 and TP10), which measure activity from the temporal lobe.
Though the core functionality of the headband is to help you get into your zen mode, you can do WAAAY cooler stuff with the tech.
Can you build with the Muse 2?
I’ve spent the last year tinkering with the Muse 2, and I’ve built a bunch of fun projects with the headset. For inspiration, here’s a summary of some of those projects:
- Hands-free slideshows with EEG eyeblink detection
- Using a web browser with EEG artifacts and focus/concentration
- Making custom video summaries using EEG
- Improving accessibility and transparency in Social Media using a P300 Speller and Emotion Detection (*this project was made for Emotiv’s suite of consumer EEGs, but it also supports the Muse 2)
These projects are just the tip of the iceberg in terms of what can be done with the Muse 2, but getting started with the headband can be a bit of a pain, and hopefully, this article will help you avoid the mistakes I made when starting off.
Don’t reinvent the wheel, get help from others
I imagine you’re in the position where you played around with the Interaxon Meditation app for a while and got bored, so you’re here reading this article on how to do some cool sh*t. Before you get started, join these slack/discord channels. These communities will help you out a ton!
- Brainflow Slack — Brainflow is a useful python library that provides functions to filter, parse, and analyze EEG data from various headsets.
- NeurotechX — An international community of 23k fellow neurotech enthusiasts in 30 cities worldwide. This is one of my go-to channels for finding ways to troubleshoot my Muse 2.
- LabStreamingLayer Slack — You’ll find yourself using the lab streaming layer (LSL) a ton with the Muse 2, so this is definitely a useful channel to join.
- Brains@play — “Brains@Play is developing an open-source framework for creating brain-responsive applications using modern web technologies.” Brains@play has a super active community and is constantly looking for new and innovative ideas for BCI web apps (if you’re into web dev, you should 100% join).
Signal Acquisition — Getting a data stream going
To start, we first need to get a stream going outside of the Muse app, and there’s a variety of ways to go about doing this. I’ll cover the ones I’ve used before and separate them by type.
LSL and OSC
Streaming in data from the Muse 2 locally is generally achieved via 2 main methods: the lab streaming layer (LSL) and open sound control (OSC).
The Lab Streaming Layer is a system that allows researchers to synchronize streaming data across multiple devices in real-time. The value of LSL comes in the fact that you can synchronize multiple data streams from different sampling at different frequencies. You may want to use other sensors alongside EEG for you’re application, and LSL ensures that both data streams will be synchronized.
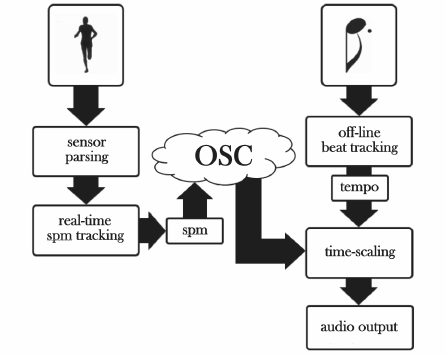
As the name implies, Open Sound Control is a protocol mostly used for sound-related applications, especially for video. Over the years OSC has been useful in a wide variety of domains beyond musical contexts. Its timing accuracy and flexibility make it a ready solution for any application that requires time-sensitive communication between software and/or hardware endpoints, and as EEG time-series require microsecond precision, OSC can provide the required system for streaming.
Both methods have their specific pros and cons, but at the end of the day, the one that is the most supported wins the race, and LSL is generally the widely used method for EEG streaming over a local network. Pretty much all of the streaming software I’ll be describing below will be primarily using LSL.
Starting an LSL outlet with the Muse 2
To use LSL for streaming with the Muse 2, you need to first create an outlet by connecting the headband. Here are some apps that can help setting up that connection.
- (Personal Choice) Bluemuse — An O.G. among the Muse community, Bluemuse provides a super minimalistic and intuitive GUI for making an LSL connection with Muse 2. Bluemuse not only has the functionality to stream EEG data from the Muse 2 but also collect data from its other sensors concurrently, utilizing LSL’s full potential. Requires Windows 10 OS.


- uvicMuse — Created by Dr. Krigolson at the University of Victoria, uvicMuse also provides all data types from the Muse 2, and can additionally stream data over UDP as well, adding support to Matlab applications. The app can also apply filters to the data being streamed (Highpass, Lowpass, Notch). Supports Mac, Windows, and Linux systems.

- (Recommended) Petal Metrics — A relatively newer app in this area, Metrics provides a variety of new features that aren’t found in the other 2 apps described above. Metrics allows you to stream via LSL and OSC, automatically logs streaming sessions into CSVs, and allows support for extra auxiliary electrodes (a huge plus!). Supports Mac, Windows, and Linux systems. This is my recommended app for starting an LSL connection because Metrics is frequently being updated with new features, in comparison to both uvicMuse and Bluemuse which are relatively dated.

Subscribing to the LSL stream — Creating an Inlet
Once you’ve set up the connection, an LSL port is opened from which you can access a data stream. The main way to access the stream is via the LibLSL library and its various wrappers (Python, Java, Matlab, etc.) for real-time analysis, or asynchronously through the Lab Recorder, where you can save the stream for later processing. In this article, I’ll specifically cover how to access this stream through the python wrapper (though similar principles apply for other languages).
Using PyLSL, the main python wrapper, you can start collecting data from an LSL connection in less than 10 lines of code!
"""Example program to show how to read a multi-channel time series from LSL."""from pylsl import StreamInlet, resolve_stream # first resolve an EEG # stream on the lab networkprint("looking for an EEG stream...")
streams = resolve_stream('type', 'EEG') # create a new inlet to read # from the streaminlet = StreamInlet(streams[0])
while True:
# get a new sample (you can also omit the timestamp part if you're
# not interested in it)
  sample, timestamp = inlet.pull_sample()
  print(timestamp, sample)
The code example above was taken from the PyLSL Github repository, and simply creates a StreamInlet object which buffers all incoming data, and prints the timestamp and data sample given the pull_sample() method.
Even better, there’s another python library called MuseLSL which abstracts PyLSL even further! MuseLSL also provides a few other nifty tricks like real-time visualization and recording.
I personally use PyLSL for development and use MuseLSL (especially its real-time visualizations) as a sanity check that my data is clean. Lab Recorder is my go-to for recording my own custom datasets and can be useful for recording EEG experiments like P300, where you stream stimuli markers in parallel to the raw EEG data.
- PyLSL
- Lab Recorder
- MuseLSL
Bonus Option for Local Streaming — Brainflow

As of recently, Brainflow, which originally supported only OpenBCI’s headsets, supports Muse 2 for streaming. Andrey Parfenov, the creator of Brainflow, made an article about the differences between LSL and Brainflow’s streaming method that you can find here, but the main takeaway is that Brainflow doesn’t require a user to create a stream from additional applications (like Bluemuse), so everything can be done from within a single SDK. Brainflow streaming requires a BLED112 dongle.
# Code example for logging data from the Muse 2import time
from brainflow.board_shim import BoardShim, BrainFlowInputParams
from brainflow.data_filter import DataFilter, FilterTypes, AggOperationsdef main():
BoardShim.enable_dev_board_logger()params = BrainFlowInputParams()
params.serial_port = "COM port for BLED112 Dongle"
params.timeout = "timeout for device discovery or connection"board = BoardShim(22, params)
board.prepare_session()board.start_stream() # use this for default options
time.sleep(10)data = board.get_board_data()  # get all data and remove it from internal bufferboard.stop_stream()
board.release_session()print(data)if __name__ == "__main__":
main()
Streaming the Muse 2 for Web Development
When it comes to streaming the Muse 2 for any type of development, the device can be connected to Web Bluetooth API just like any other Bluetooth device, but I’ll be covering a few other substitutes in this article since there are hundreds of sources online discussing the use of Web Bluetooth.
- Node-LSL — Conveniently, you can continue using LSL when you move to web dev with Node-LSL which provides a similar process to connect to the Muse 2 like in python. Additionally, if you were to use this method in an app meant for deployment, you would also have to create an interface where users can instantiate an LSL stream outlet (similar to Bluemuse).
- TimeFlux — Written in python, TimeFlux provides a graph-based method for going about running closed-loop BCI applications. The beauty of Timeflux is its wide selection of plugins that can be used as part of a graph, essentially eliminating the need for any code for any type of manipulation of the EEG signal after a stream is set. If you wanted to use TimeFlux for web development, you would simply add in a “UI” node that would specify you’re frontend. This application also uses LSL so you would need to use Node-LSL or some other library in parallel to create an LSL stream inlet.
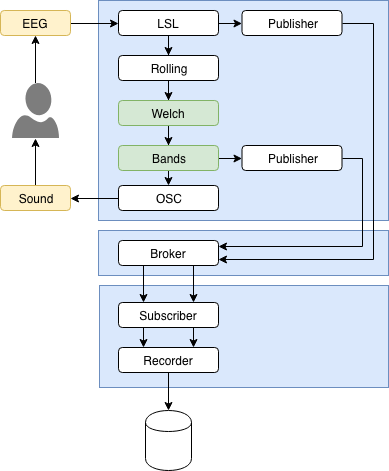
- Personal Choice: Brains@play — Brains@play provides an awesome framework for developing brain-responsive web apps, using a similar graph-based structure to that of Timeflux, but with a few more bells and whistles. Brains@play handles all of the Web Bluetooth connection work through the data atlas where all user data is stored and can be accessed from the UI when a device connects. Brains@play also has amassed a variety of its own plugins, such as blink detection, which can be used effortlessly with the Muse 2 to map to different controls (e.g. keypresses). Additionally, brains@play also provides multiplayer functionality, which opens the possibility for brain-to-brain apps.

Streaming data through a Mobile Device
In terms of mobile development, there aren’t any solid frameworks as of right now for developing with the Muse, but there is one app that provides utility in you’re BCI development ventures. I’m talking about the revered Mind Monitor.

This application is super popular among the research community as it provides an easy, no-code method of signal acquisition and analysis. Mind Monitor allows users to both view real-time plots of EEG data, and record data for later analysis. This can be an easy way to collect data from a target audience for a large-scale research/development project. Additionally, Mind Monitor can provide an OSC stream that can be accessed from a separate device. For example, if you created an application that uses OSC for signal acquisition, you can simply ask users to stream data out of Mind Monitor instead of explicitly creating your own inlet.
What to use for Digital Signal Processing
Now that you have a live EEG you are one step closer to wielding the force, but there’s still one more thing we have to do. Raw EEG looks like a child’s drawing, and it’s even more difficult to understand, but over the years, we’ve come up with clever ways to get what we want from the data.
If you are a beginner in the field, I advise you to take a look at core concepts like Power Spectral Density, and Wavelets before continuing on. If you have prior skill with ML, you might be able to get away with just using raw data for your apps but to actually get good results, you want to generally follow a 2 step process of:
- Preprocessing EEG to eliminate irrelevant noise,
- and applying transforms to the data to get relevant information
Once you have a decent understanding of what basic signal processing methods do, you’ll have a breeze in terms of applying these methods in practice.
Here are some of my most used python libraries for digital signal processing:
- Recommended for analysis: MNE — The industry standard for neurophysiological data processing, MNE provides end-to-end utilities for managing EEG. With MNE, you can find all the analysis methods that you can think of with this package, from time-frequency analysis to source localization. Once you load your raw EEG data into MNE objects (Raw and Epochs objects), it’s only a matter of calling a few methods to get the data you need. I would personally start learning and using this library before moving on to the next ones.

- Brainflow — Another library specializing in Neurophysiological data, focuses less on post-recording analysis, and more on real-time analysis of EEG, meaning many of the library’s functions take in single epochs of data. Brainflow goes for more of a brain-computer interface supportive approach in comparison to MNE. Brainflow’s filters and transforms are also more beginner-friendly compared to other libraries, as they don’t require the data to be in a certain format, and many of the filter designs have attributes that are predefined. Brainflow also comes with a few pre-trained models that can be used for predicting relaxation and concentration among other things.
- Scipy — If you’ve done any python programming before, you’ve probably ended up using the Scipy stack one way or another, and conveniently Scipy also provides a few modules that can be used for EEG processing, specifically scipy.signal and scipy.fft. The signal module provides foundational blocks necessary for creating your own filter designs, can create spectrograms and wavelets, and create windows, which are all important parts of an EEG preprocessing pipeline. The fft module on the other hand simply allows you to apply a Fast Fourier Transform on your signal, which is an intermediary step in many analysis methods with EEG. Using SciPy for EEG signal processing definitely requires more technical knowledge, because of how much can be tuned and customized.
- Antropy — Entropy in a general sense is interpreted as the amount of randomness in a system, and is an important metric in EEG analysis. Spectral entropy, Shannon entropy, sample entropy, and other entropies provide a valuable feature set for various applications, such as emotion detection, and Antropy provides most of them. It’s my go-to library in terms of calculating entropies.
- PyWavelets — Wavelets are a very valuable asset to a BCI developers tool-kit, and PyWavelets provides an easy way to implement them in your pipeline. The library provides most families of wavelets, continuous wavelets, and functions for both decomposition and recomposition of discrete wavelets.
# takes only 2 lines of code to get wavelet coefficients :)
import pywt
cA, cD = pywt.dwt(eeg_data, 'db1')- Recommended for R-T: Wyrm — To be concise, Wyrm aims to be the MNE for brain-computer interfaces applications. Wyrm is optimized for real-time use and provides a very similar system as MNE, where you first load in your raw EEG into a Wyrm Data object, and from there you’re able to apply a wide variety of filters, transforms, and segmentation techniques. Though this library is less popular compared to its counterpart, I still recommend using this library because of its all-in-one real-time capabilities.
To finish off, it doesn’t matter which selection of libraries you use for preprocessing EEG data, however, it’s crucial that you do constant sanity checks on your data throughout you’re pipeline to make sure that you’re transforms are accurate.
Visualizing Muse 2 data
Speaking of sanity checks, there’s no better way of doing them than with visualizations! Validating the signal quality of the Muse 2 can be done efficiently by using plots. Python is littered with tons of amazing visualization libraries, the king of them all being MatPlotLib, but in this section, I’ll cover some substitutes that can be valuable in plotting EEG.
- MNE — One can’t discuss EEG visualizations without bringing up MNE! This library provides a ton of methods to plot everything from averaged event-related potentials to scalp topographies, and these can be called on the raw data once they’ve been loaded in MNE’s data objects. MNE also supports real-time plotting, which is a huge plus.

- Wyrm — Needless to say, being MNE’s real-time counterpart, Wyrm also boasts its own share of visualization techniques. Though less extensive compared to MNE, it still holds up in regards to the classics, like spectrograms and topographic maps. Wyrm can be used for real-time plotting if used alongside MatPlotLib’s animation module.

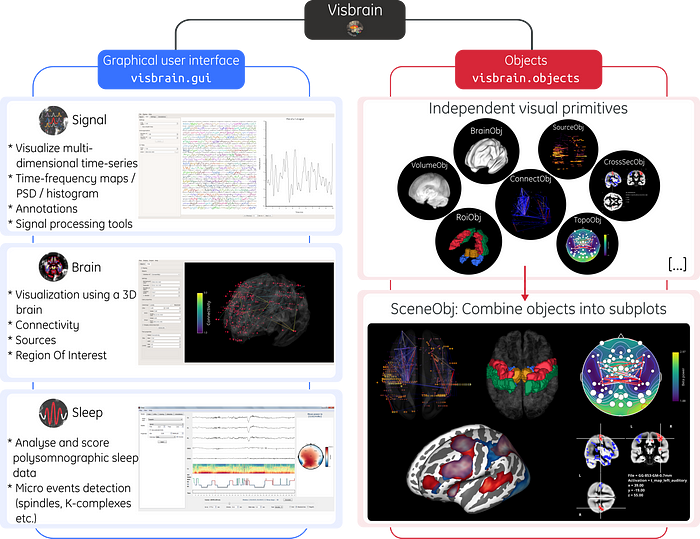
- Visbrain — This library can be a highly valuable tool if you’ve decided to go on the path of avoiding both MNE and Wyrm. Visbrain allows you to directly plug in a NumPy array into one of its various objects to plot data, and provides all of MNE’s plotting functionality (aside from source estimation). Visbrain is split into 3 main modules: the brain module, which utilizes MNI space plots, the sleep module, which visualizes and scores polysomnographic data, and signal, which visualizes multi-dimensional datasets.
- Fastest method for R-T plotting: MuseLSL — Before any recording sessions, I always use MuseLSL to plot raw EEG in real-time to validate that my headset is fitted correctly; it’s a super quick option; all you have to do is run this command in the console once you’ve pip installed the library and have initialized a Muse 2 LSL outlet (using Bluemuse or any other method described in the signal acquisition section) :
muselsl view # this will start a live EEG plot using PyGatt as the backend
A Useful Bonus — EEG-Notebooks
Created by the NeurotechX community, EEG-Notebooks provides an awesome collection of EEG experiments that you can run with the Muse 2 right out of the box. You can simply create the environment using these commands:
conda create -n "eeg-notebooks" python=3.7 git pip

conda activate "eeg-notebooks"

git clone https://github.com/NeuroTechX/eeg-notebooks

cd eeg-notebooks

pip install -e
and start running the experiments like so:
eegnb runexp -ipThese notebooks also provide foundational code for:
- LSL connections,
- visual and auditory stimulus presentation,
- and signal processing, statistical, and machine learning EEG analysis
I would definitely keep these notebooks in mind for code samples to get your projects started.
TL;DR — A 3-Step Process
1. Signal Acquisition
Local Network:
- Starting an LSL outlet with the Muse 2
2. Creating an LSL inlet to stream in EEG data
Streaming the Muse 2 for Web Development:
Web Bluetooth API is the straightforward method, but there are substitutes:
Streaming the Muse 2 through a mobile device:
2. Signal Processing
3. Visualization
Matplotlib will suffice, but here are some other libraries that can extend your capabilities:
Final Thoughts
Regardless of what libraries you use to visualize your data, or what method you use to stream your Muse 2, it’s important to know that there is a supportive community that can provide help with every step of the way. If you don’t seek help/understanding during your BCI dev journey, it won’t be easy, and it’ll also be less fun. Finding your people should be a priority early on because that’s how you can have the greatest impact with your BCI development!
For a first project, always start by replicating something. Be considerate of the electrode positioning of the Muse 2; something like visual evoked potential may be difficult to detect because there are no electrodes positioned close to the occipital lobe. With these initial projects, you should get used to the whole process of:
- Getting the raw signal
- Cleaning the raw signal with filters
- Applying transforms on the data to get a meaningful feature set
- Predicting something from the data
- Mapping the predictions to some action
This is generally the process that you’ll see most common, and if you master these steps, you’ll be able to work on any BCI project you can imagine. Do you know the saying “only the sky is the limit”? In a BCI developer’s case, only our brains are the limit.
Thanks for reading! You can find me on Linkedin here, and Github here.
